Pathogen comparison
Click through the following tabs to see how the pathogens compare on key indicators of suitability to vaccine development.
Each pathogen was evaluated on the same key indicators, allowing for comparison between the pathogens. A detailed description of the methodology for each of the indicators is provided in the Methodology section. More information on each pathogen’s scoring can be found in the pathogen profiles section. Throughout the assessment it is important to note that the focus was the development of vaccines against all strains of the pathogen – not just those that display AMR.
The clusters that emerge are as follows:
- The “increase uptake” cluster (dark blue) is composed of effective, marketed vaccines where the key intervention is to increase uptake
- The “bring to market” cluster (light blue) is composed of pathogens with significant potential health impact where knowledge of pathogen biology and R&D is sufficiently advanced to concentrate on accelerating vaccines through clinical development to market
- The “advance early R&D” cluster (green) is composed of pathogens with significant health impact where more investment in early-stage R&D is needed to develop and advance a robust pipeline of vaccine candidates
- The “collect data, explore alternatives” cluster (grey) is composed of pathogens that are less well-suited to vaccine development, as well as pathogens where more information is needed to determine whether vaccine development should be a priority
The interactive matrix below highlights the pathogen clusters. To explore how the components of Health impact and Probability of R&D success effect the placement of pathogens on this matrix, please change the weightings used for each component. Default weightings:
Health Impact: Mortality (50%), Morbidity (20%), Urgency of AMR threat (30%).
Probability of R&D success: Pathogen biology (30%), Pre-clinical and clinical R&D (30%), Pipeline robustness (40%).
Probability of R&D success (x-axis) was scored by totalling the weighted scorecard scores for each pathogen on: pathogen biology, pre-clinical and clinical R&D and pipeline robustness and using the weighting specified below. The range of the combined score is 0-100. Health impact (y-axis) was scored by totalling the weighted scorecard scores for each pathogen on: mortality, morbidity and urgency of AMR threat and using the weighting specified below. The range of the combined score is 0-100.
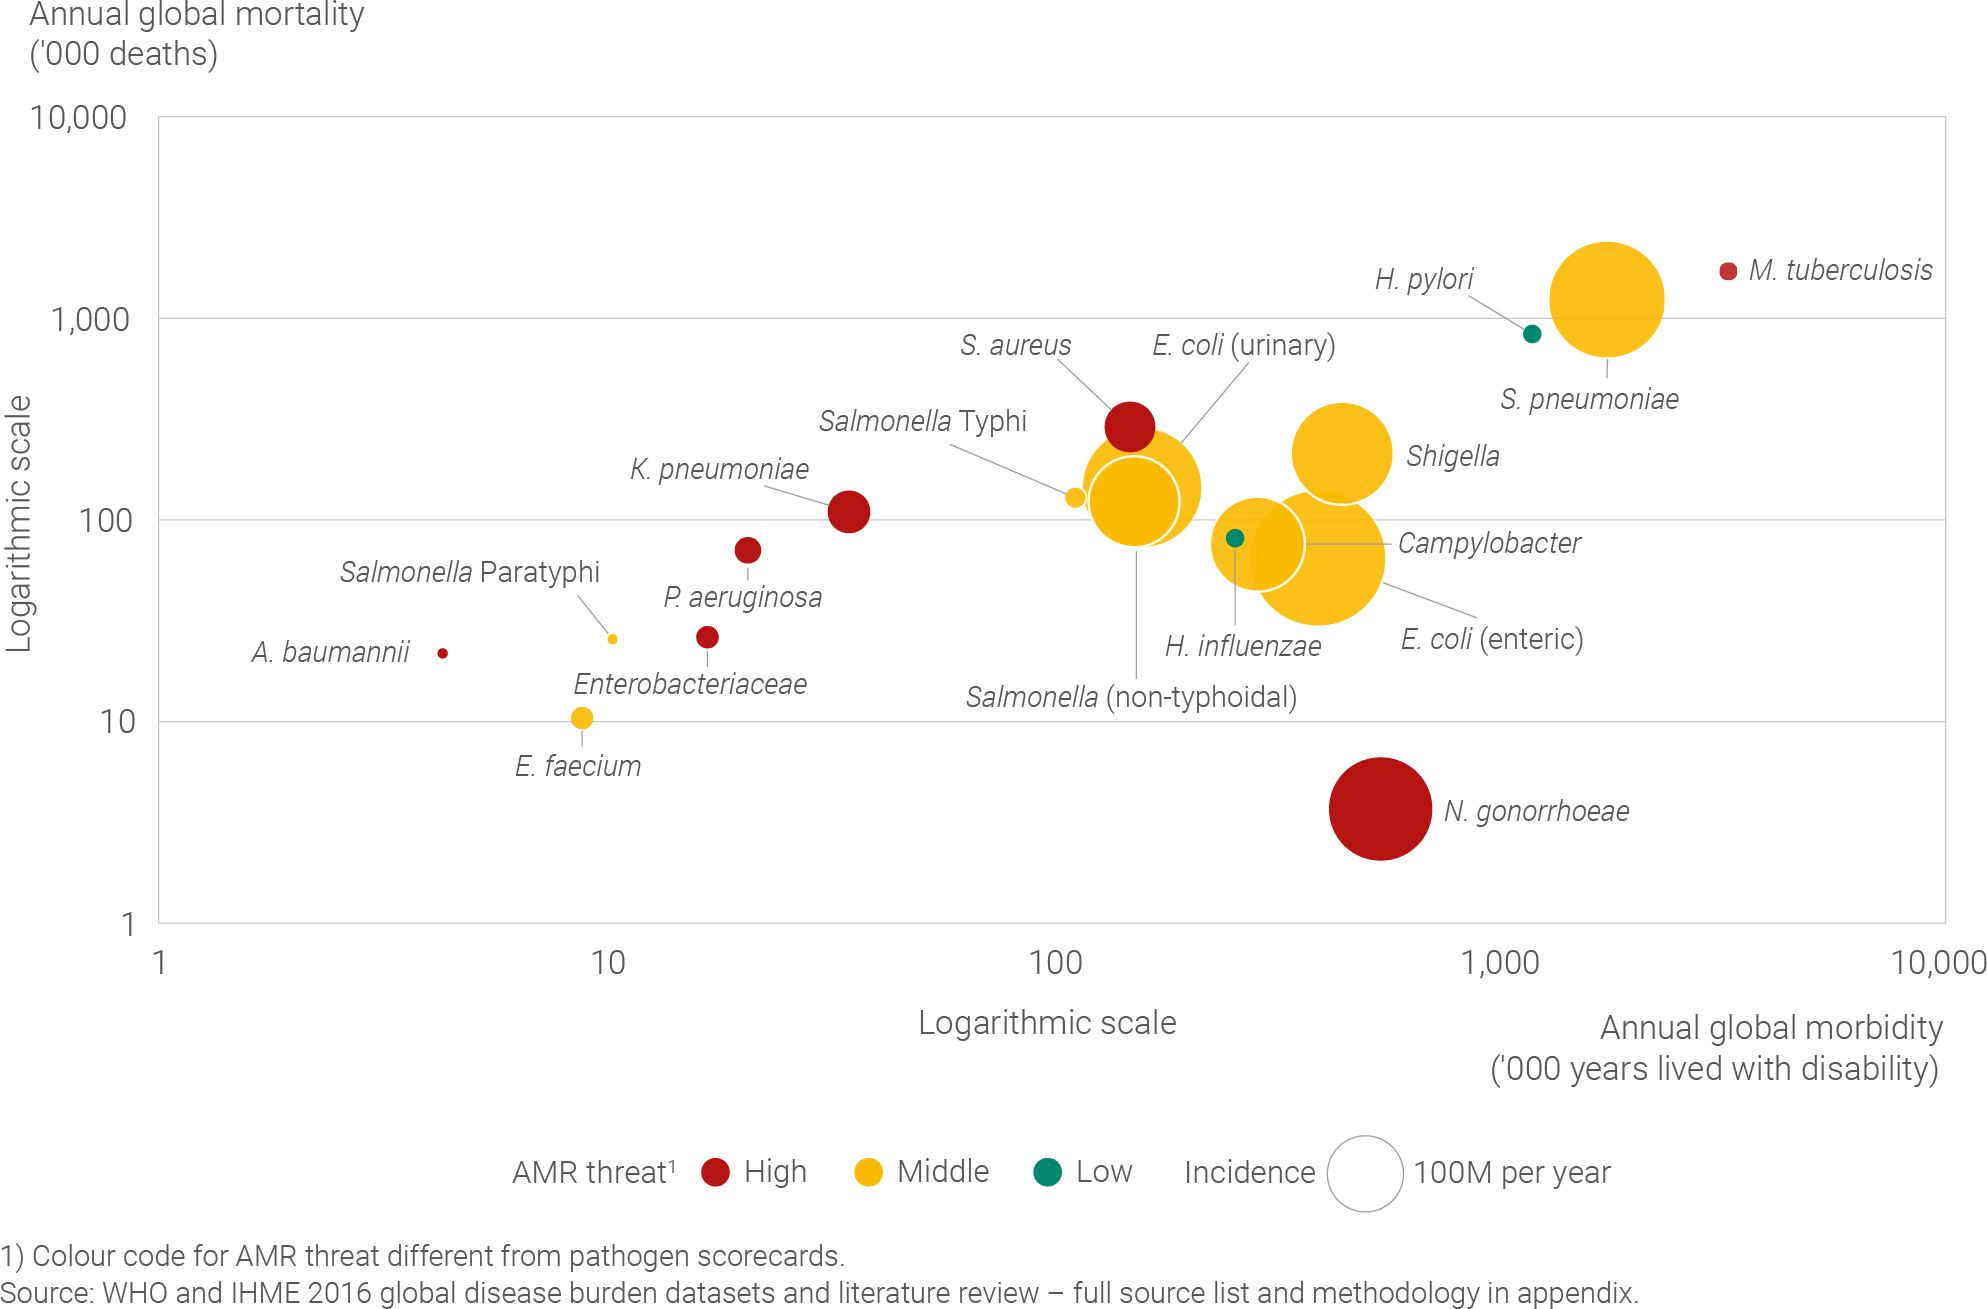
When global mortality and morbidity for each pathogen are plotted on the logarithmic scale below, these differences become apparent, creating a clear distribution of potential impact across the pathogen set. For example, mortality for M. tuberculosis at ~1.7 million deaths per year is almost three orders of magnitude greater than that for N. gonorrhoeae at ~4,000 deaths per year.
Most of these pathogens distribute on a diagonal, whereby mortality and morbidity increase in step. The clear outlier is N. gonorrhoeae, for which the health impact is driven by morbidity, reflecting the high burden of chronic untreated infections.
Please click on image for printable version
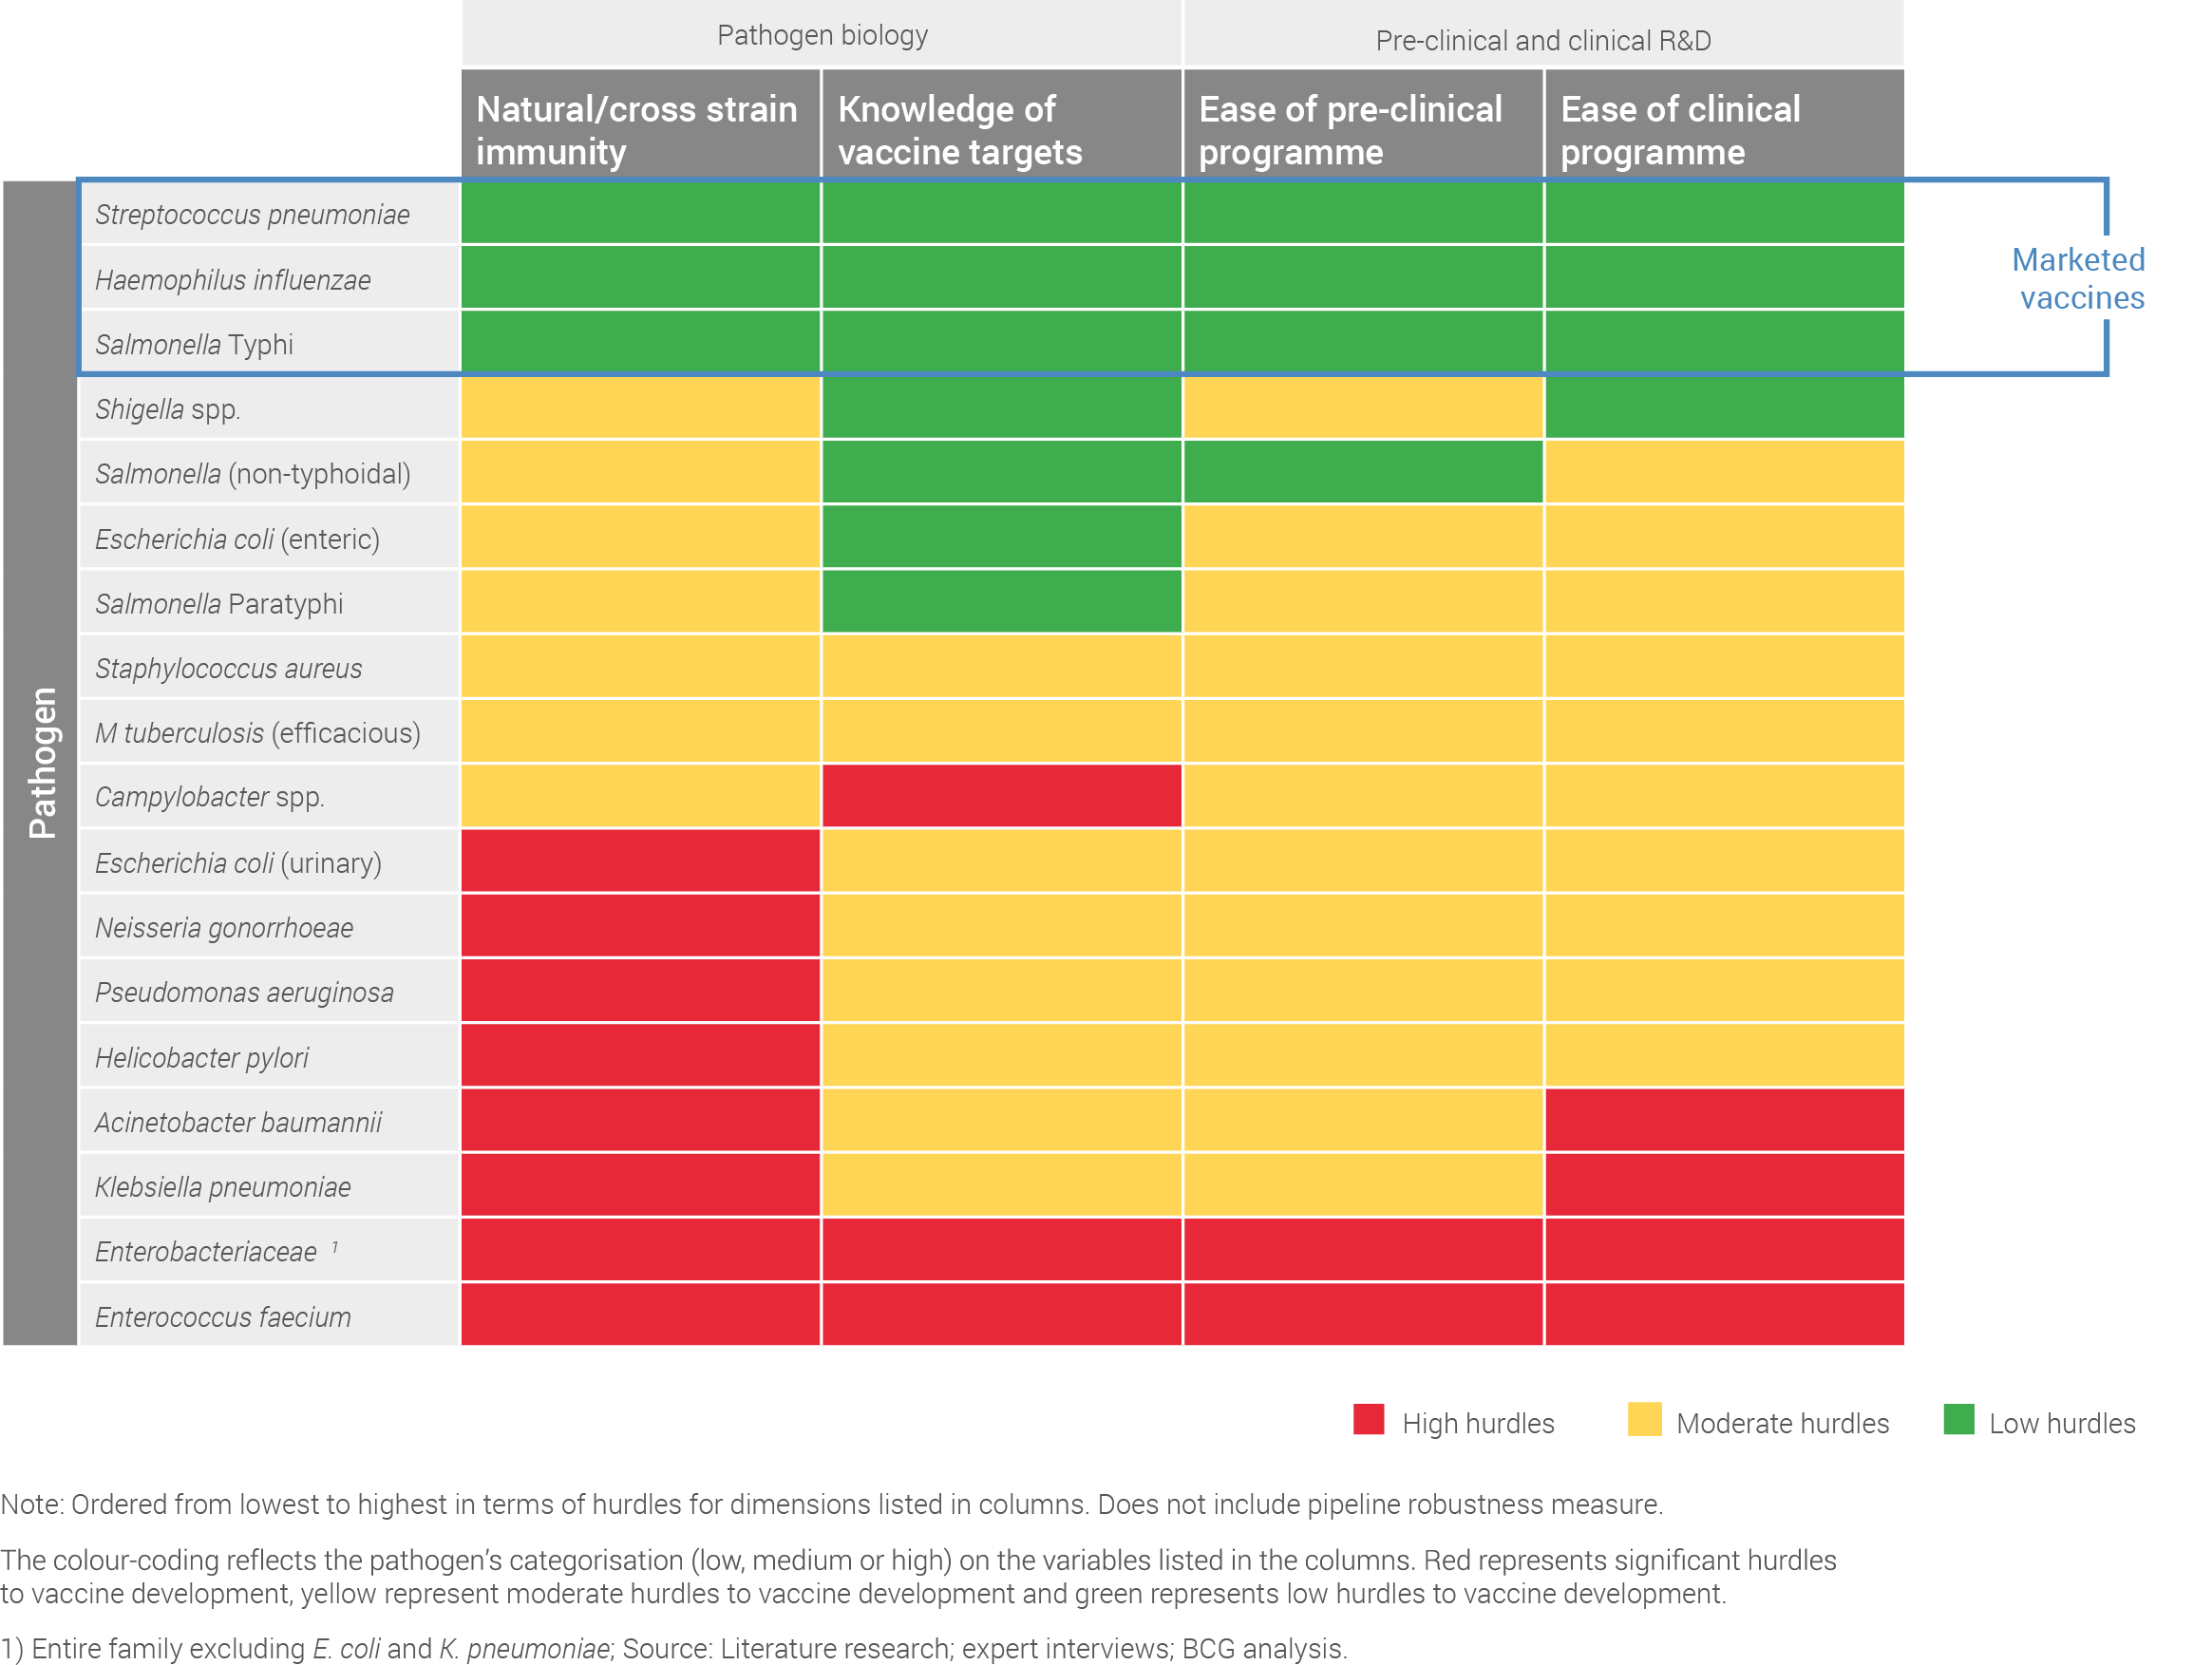
Pathogens also vary greatly in their suitability for vaccine development. When examining the probability of R&D success, the pathogens range from very high feasibility – primarily capturing the licensed vaccines for S. pneumoniae, H. influenzae and S. Typhi – to very low feasibility, capturing the real challenges in developing a vaccine for pathogens such as E. faecium.
It is also important to note that significant technical hurdles still remain for nearly all pathogens without a licensed vaccine.
Please note: The green shading on the chart conveys low technical hurdles to the development of a vaccine against the specific pathogen, the yellow shading conveys medium hurdles and the red shading conveys high hurdles.
Please click on image for printable version
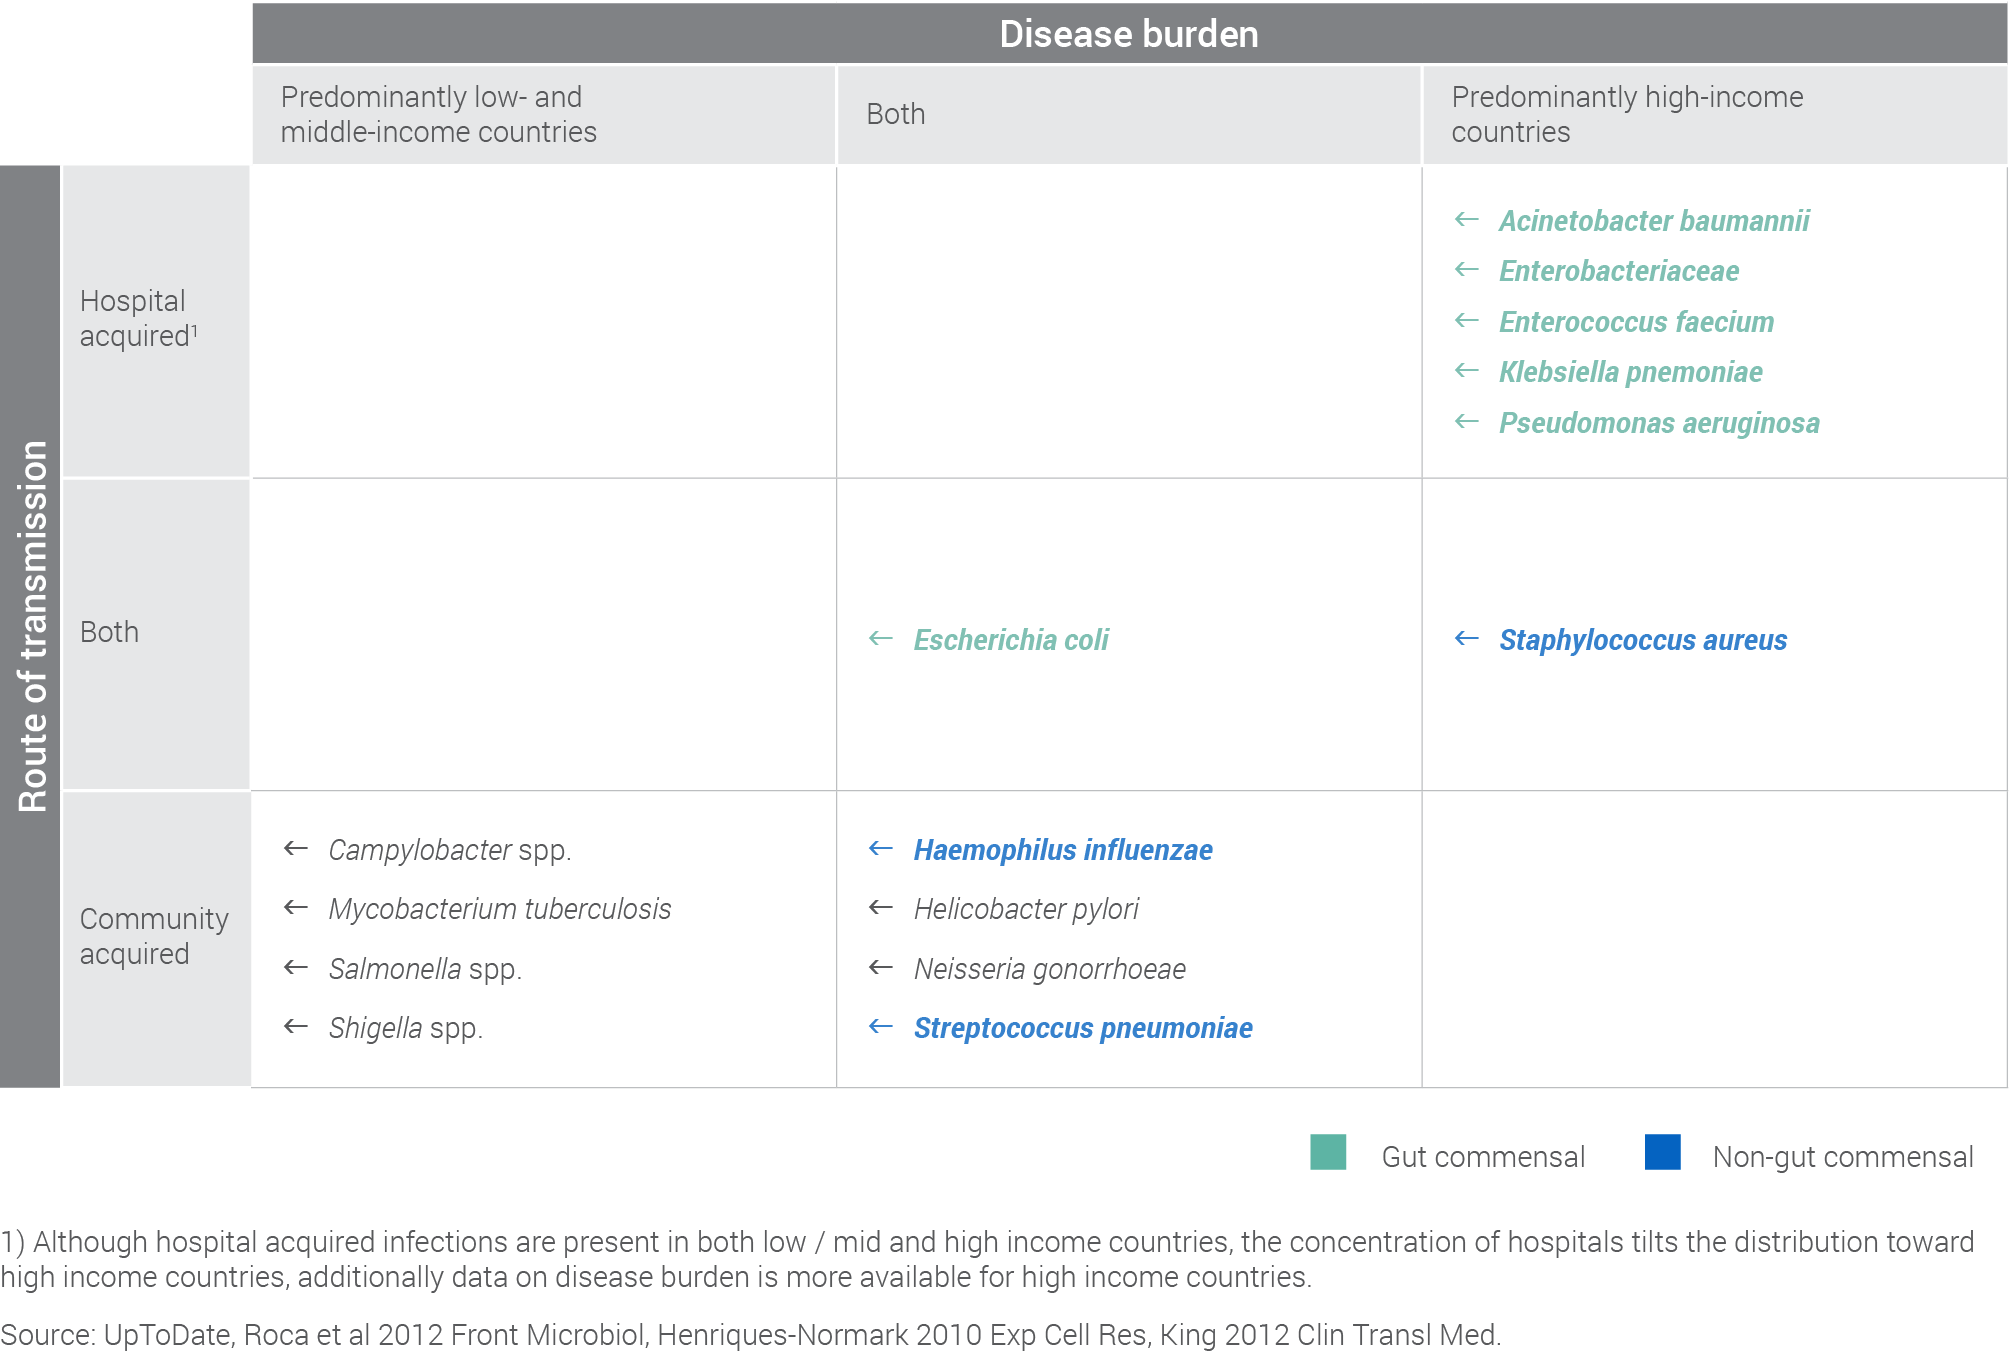
When evaluating uptake, significant differences in transmission and geographic distribution across the pathogen set drive complex uptake dynamics.
Please click on image for printable version
The geographic distribution of disease burden is a key factor shaping market dynamics. Support from Gavi can drive uptake if the disease burden is predominantly in low- and middle-income countries. Therefore, the extent to which a pathogen fits the Gavi funding criteria will to a large degree inform the probability of uptake. If a pathogen is also prevalent in high-income countries, the identification of a commercial market is critical to improve the probability of uptake. Where pathogens have a global prevalence, a potential dual market exists.
Uptake dynamics are particularly challenging when Gavi-supported countries are the primary market for a vaccine, but the pathogen causes relatively low mortality. For example, Campylobacter infections primarily impact low- and middle-income countries that are supported by Gavi, but mortality is low relative to other pathogens in this assessment at ~75,000 deaths per year. As Gavi support is heavily influenced by health impact, and Gavi’s criteria for support currently places significant emphasis on reducing mortality, low mortality may limit Gavi support.
The mode of transmission is also a key factor in developing vaccination strategies. Community-acquired infections usually require routine vaccination. This comes with well-understood benefits and challenges of joining the existing schedule. Hospital-acquired infections may require more targeted strategies. However, these targeted approaches are currently less well-defined, and this significantly impacts the probability of uptake.
Developing a cost-effective vaccination strategy to drive uptake is challenging for hospital-acquired infections that lack a clear, well-defined target population. For example, although K. pneumoniae is common cause of hospital-acquired infections, accurately predicting who is at risk of infection remains a significant challenge. As infections cannot be accurately predicted, a large population would have to be vaccinated. This approach would significantly reduce cost-effectiveness, and therefore impact uptake.
Finally, without compelling evidence of significant mortality and morbidity it may be particularly challenging to drive the high global uptake of a vaccine required to realise a potential impact. For example, H. pylori is associated with peptic ulcer disease, which is often not seen as a serious health condition. Although evidence suggests that H. pylori also causes gastric cancer there is little public awareness of this link, potentially limiting the appetite for vaccination.
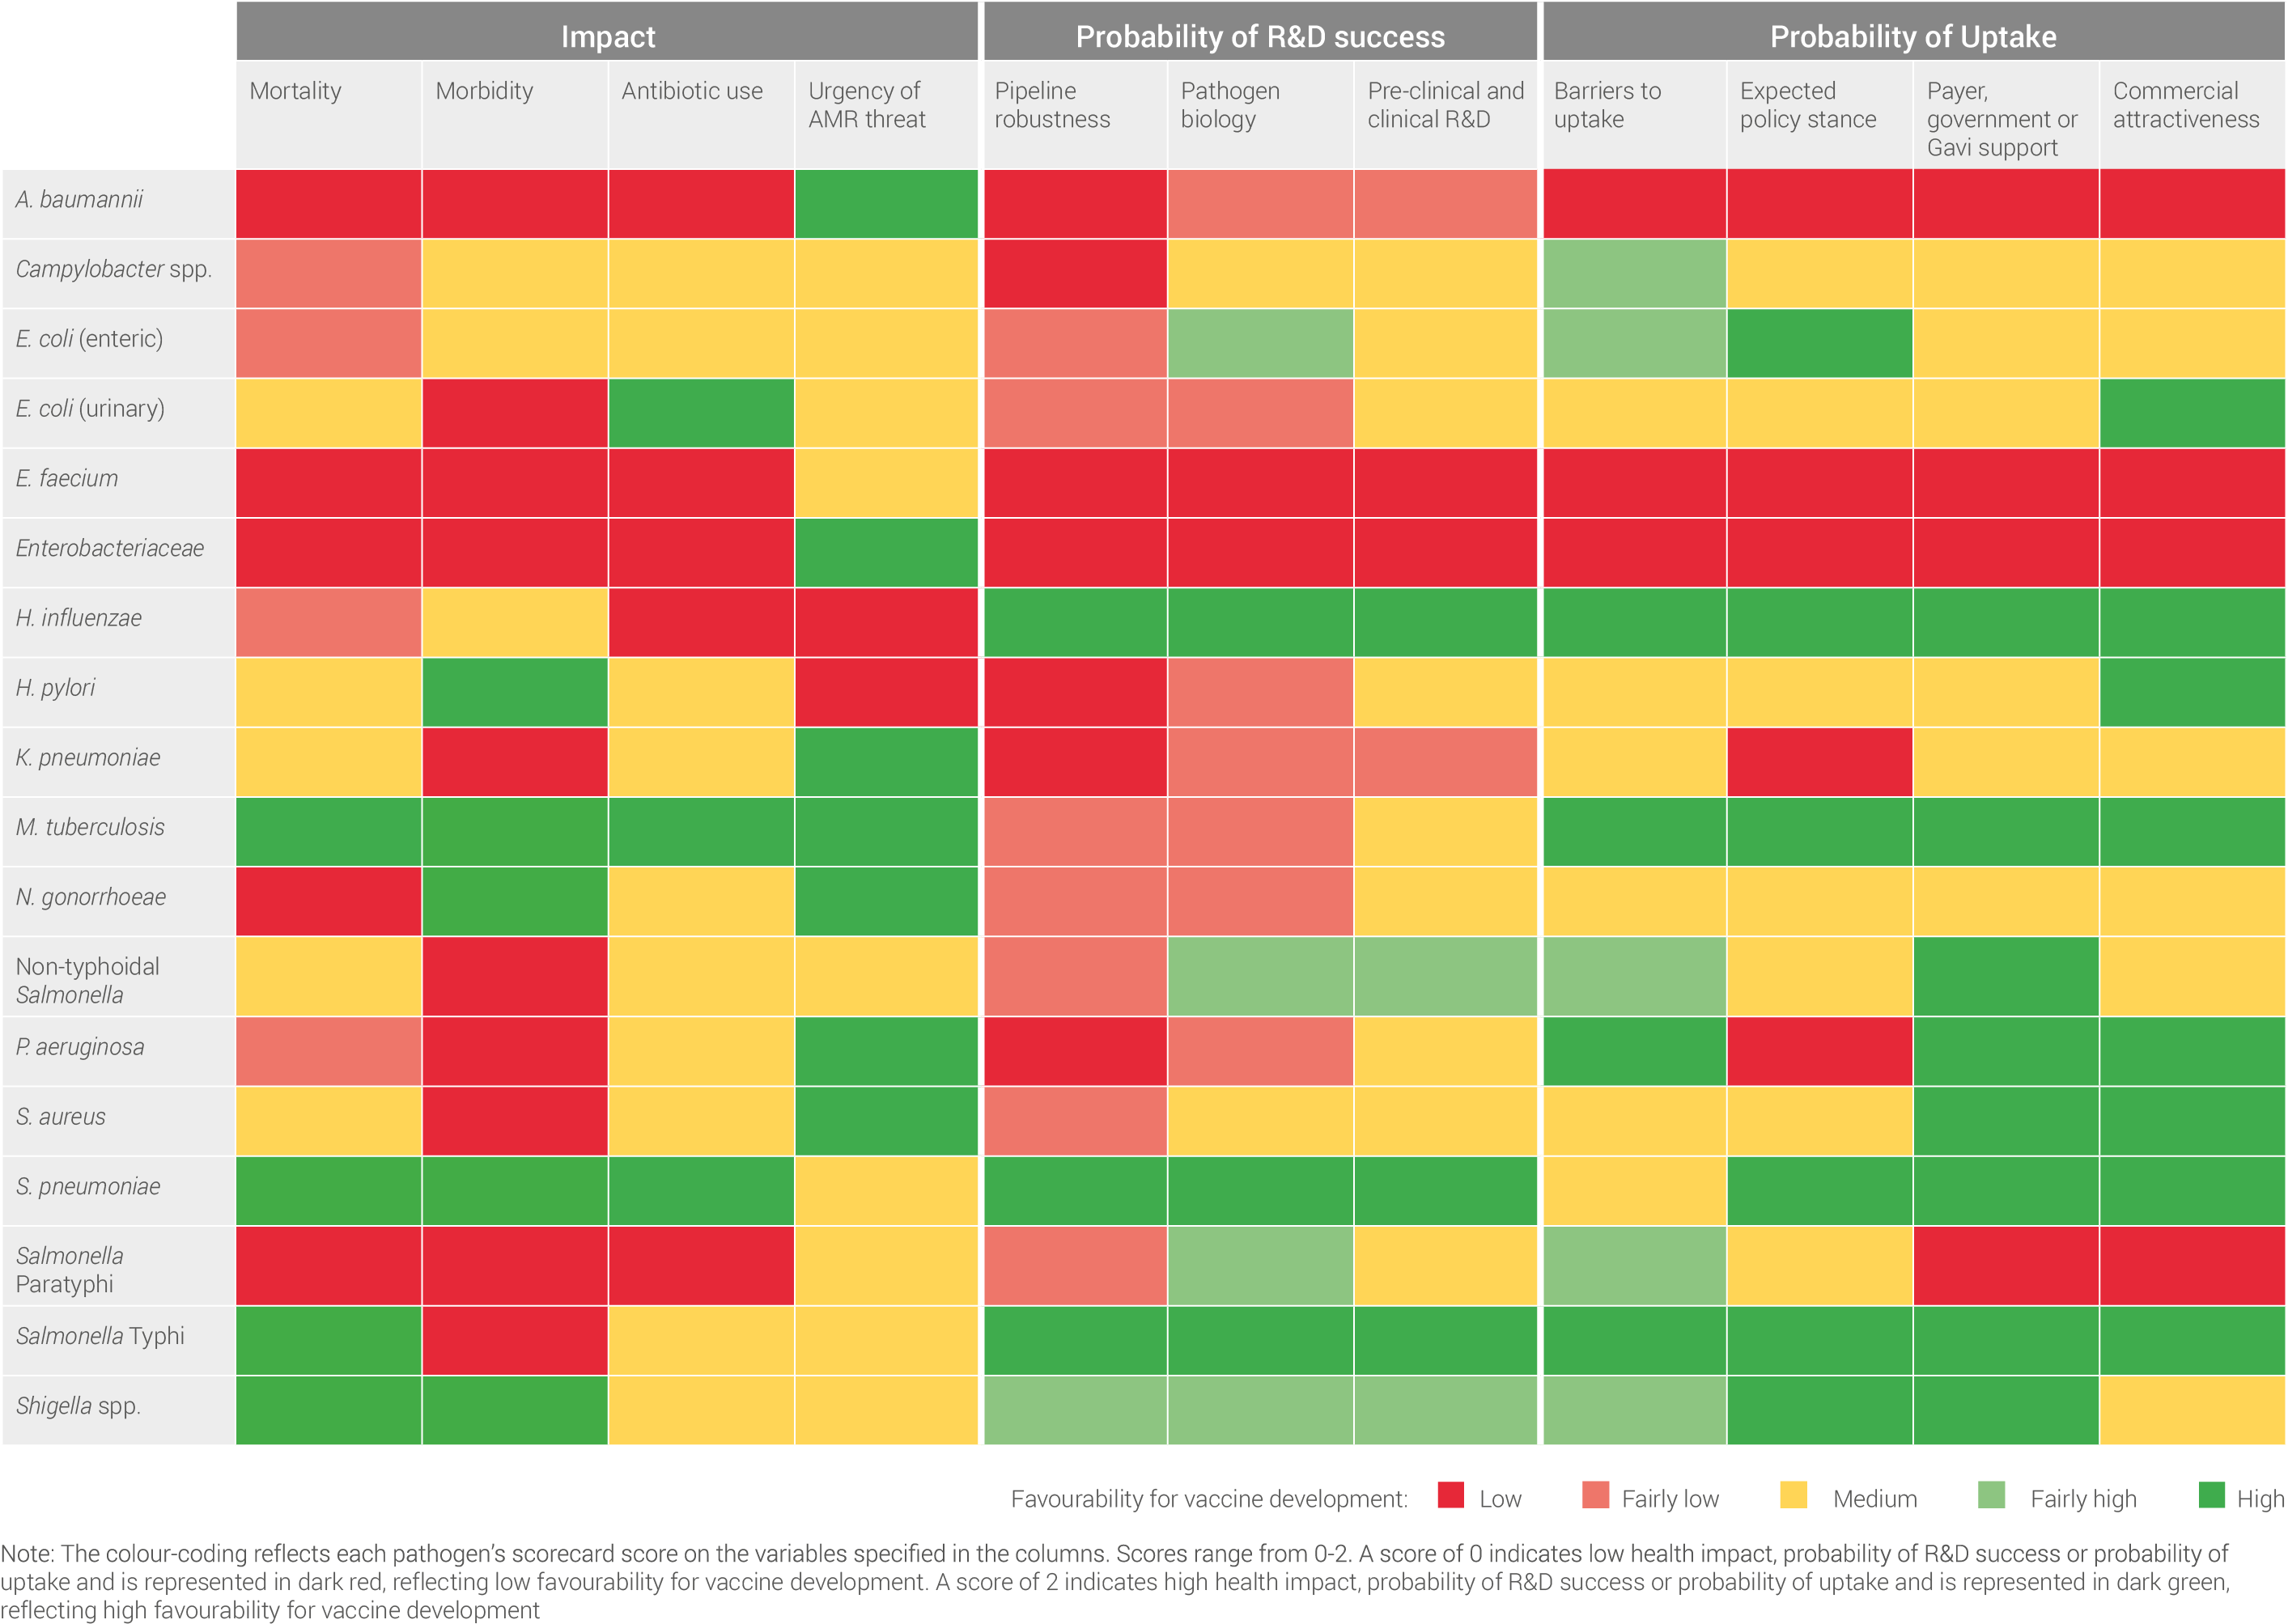
The results of the scorecard assessment across all of the pathogens can be seen on the heatmap below, which displays all the scorecard assessments side-by-side. For each pathogen, each indicator is scored from 0-2 and colour-coded based on this score. Scores range from low health impact, probability of R&D success or probability of uptake (score of 0: represented in dark red) to high health impact, probability of R&D success or probability of uptake (score of 2: represented in dark green).
Please click on image for printable version
The data reflected in this table has varying levels of confidence. In particular, the figures for antibiotic usage are estimates based upon the estimated global incidence of disease caused by the pathogen and typical antibiotic treatment regimens.
A detailed assessment and recommendations for each pathogen can be found in the individual pathogen chapters.
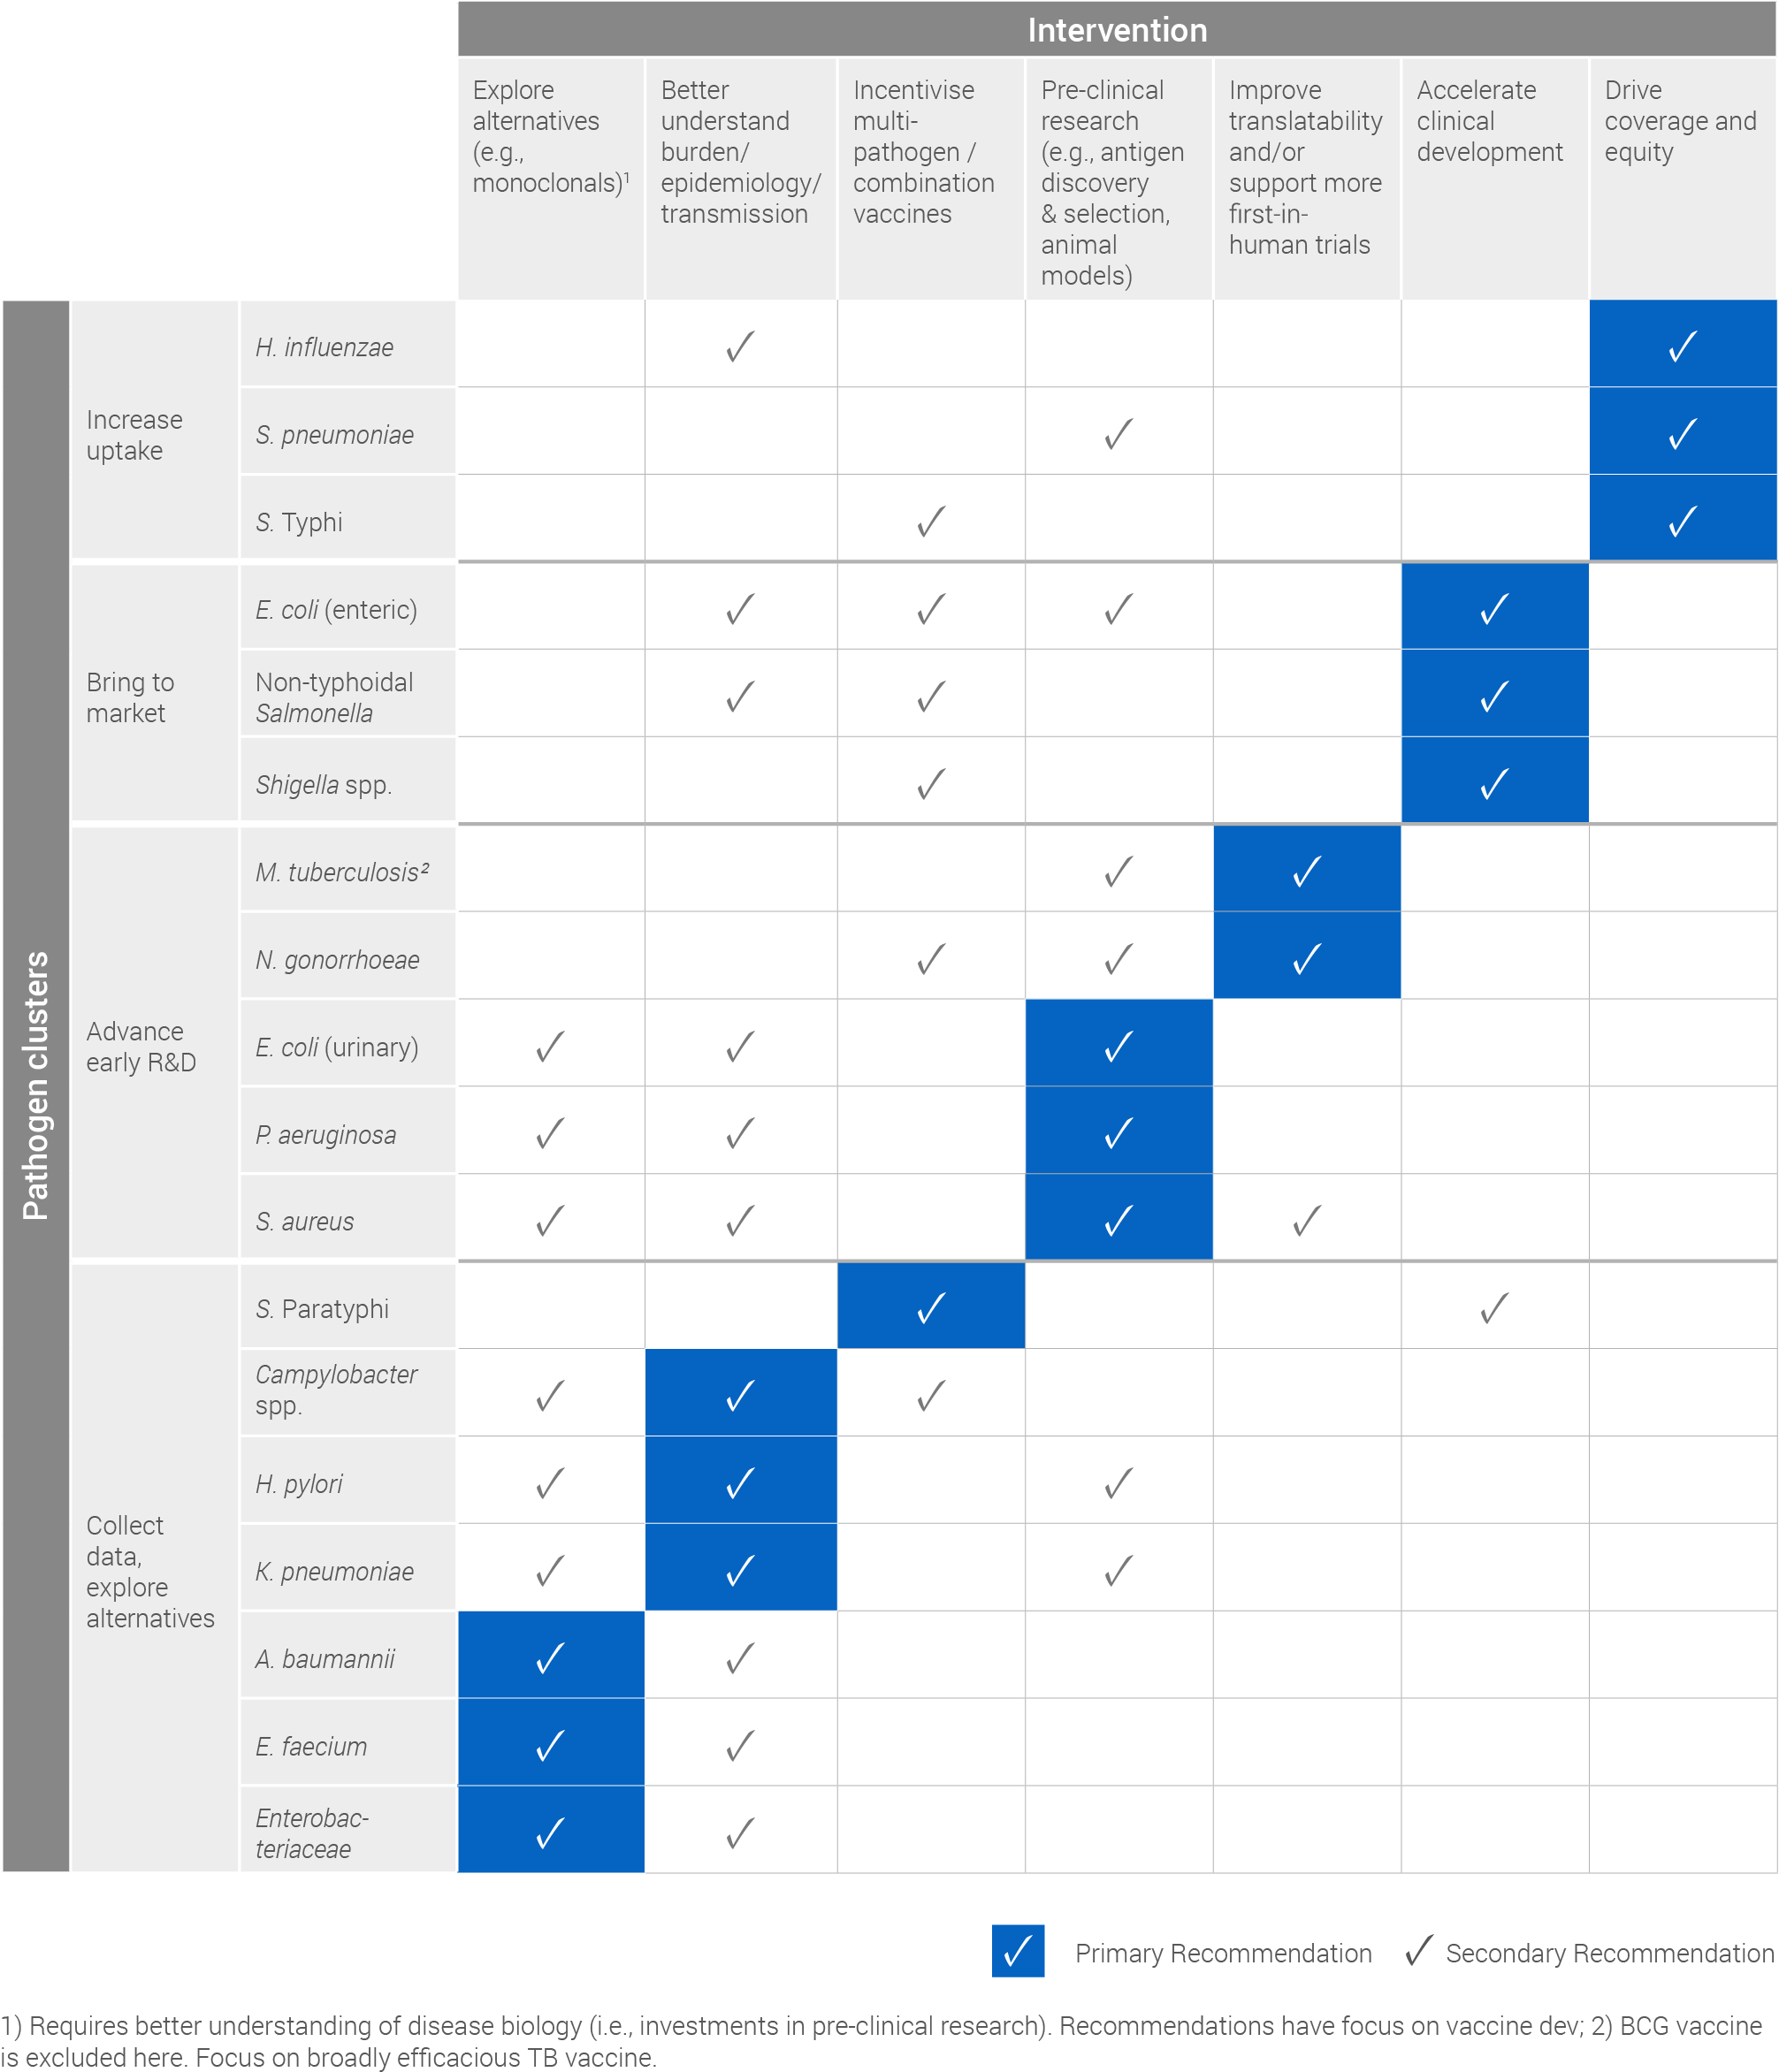
Based on its cluster, each pathogen has a primary, or most critical, recommendation for intervention which has been summarised in the following table. Secondary recommendations, which detail other actions that can help advance vaccine development or uptake for each pathogen, have also been included.
Please click on image for printable version
