Methodology
Each pathogen was evaluated based on the potential health impact of a vaccine against the pathogen, the probability of R&D success and the probability of vaccine uptake. The assessment evaluated the development of vaccines against all strains of each pathogen – not just those which display AMR. Detailed sources and methodology for each of these metrics are provided below.
Introduction
This chapter lays out the detailed methodology, data sources and scoring system behind the scorecard assessment made for each pathogen. Also discussed is the scope of this project and how pathogens listed by the WHO were further sub-divided for the purposes of this report.
Scope of this project
The scope of this project was limited to the pathogens on the WHO global priority list of antibiotic resistant pathogens. Although M. tuberculosis is not included on the WHO priority list, the WHO have already established M. tuberculosis to be “a globally established priority for which innovative new treatments are urgently needed”. Therefore, M. tuberculosis has been included in this assessment.
The WHO priority list was chosen for the scope of this project as it provides a starting point for pathogen comparison and was developed from consultation with a wide range of experts and a thorough review of available data. However, experts highlighted that this list may not be complete and that there are other pathogens – bacterial, viral and parasitic – that contribute significantly to AMR. The WHO list was also designed with a different purpose in mind – guiding the R&D of new therapeutics rather than vaccines.
Recognising the potential need to expand the scope of this project at a later stage, the scorecard system has been designed to be durable to cover additional pathogens as required.
Sub-division of pathogens
The following pathogens listed by the WHO were further sub-divided for the purpose of this report:
Enterobacteriaceae: This group was defined by the WHO as including K. pneumoniae, E. coli, Enterobacter spp., Serratia spp., Proteus spp., and Providencia spp., Morganella spp.
This group was split into three parts – K. pneumoniae, E. coli and other Enterobacteriaceae to reflect the greater health impact of K. pneumoniae and E. coli compared to the rest of the group and also reflects the paucity of data on the other pathogens in this group.
E. coli: E. coli can be divided into multiple different subtypes with significant differences in epidemiology, clinical importance and R&D implications. Recognised subtypes include Enterotoxigenic (ETEC), Enteropathogenic (EPEC), Enteroinvasive (EIEC), Enterohaemorrhagic (EHEC), Enteroaggerative (EAEC), and Uropathogenic (UPEC) E. coli.
To facilitate a useful comparison two E. coli groupings were created – E. coli (enteric) representing those subtypes causing enteric infections (ETEC, EPEC, EIEC, EHEC and EAEC) and E. coli (urinary) representing UPEC infections.
Research and development efforts for enteric and urinary subtypes are clearly delineated by different target antigens and therefore vaccine design – for example, enteric E. coli may be targeted by a toxoid vaccine but this approach would not be effective for urinary E. coli infections.
Whilst E. coli is also a cause of neonatal infections, data on the role of E. coli in the global burden of these infections is very limited and their health impact is likely much lower than the impact of enteric or urinary E. coli infections – for this reason, neonatal infections caused by E. coli were excluded from the current analysis.
Salmonella: Salmonella species encompass multiple different serotypes with significant differences in epidemiology, clinical importance and research and development implications. Serotypes are commonly divided into those which are typhoidal and non-typhoidal. Typhoidal serotypes included Typhi and Paratyphi which cause distinct clinical syndromes and have distinct epidemiology. Non-typhoidal serotypes generally cause enteric infections (“Salmonellosis”) but can in some regions also cause invasive disease (invasive non-typhoidal salmonella).
To facilitate a useful comparison, three Salmonella groupings were created – S. Typhi, S. Paratyphi and non-typhoidal salmonella.
Non-typhoidal Salmonella was not further subdivided into invasive and non-invasive subtypes as the majority of cases are not invasive and global estimates of disease burden often do not make this further subdivision.
Research and development efforts for these different groups are also clearly delineated by different target antigens and therefore vaccine design – for example, S. Typhi contains a Vi capsular antigen that is targeted by current vaccines but this antigen is absent from S. Paratyphi.
Approach to data collection
Data collection focused on collating high-quality, robust assessments whilst also making these assessments consistent across pathogens. To achieve this, wherever possible data was sourced from well recognised global datasets, primarily the IHME, WHO, Evaluate Pharma, and PharmaProjects, which ensured a high quality and consistency across pathogens.
Where global datasets were not available large, multi-pathogen review articles or meta-analyses were favoured. Only when data was not available in the above formats were individual articles in the research literature considered.
Similarly, when conducting expert interviews, several measures were taken to ensure high quality and consistency. All experts were provided with the same information at the start of the interview and a structured interview guide was used to ensure consistency in questioning.
Expert interviews were conducted in three discrete rounds. The first round involved structured interviews with a wide range of experts spanning the global health community – including organisations such as the WHO and The Gates Foundation, regulatory bodies such as the EMA, and industry representatives from large pharmaceutical companies as well as a number of smaller biotechnology companies. The second round included more detailed interviews with pathogen experts to confirm the outcomes of the assessments and the preliminary recommendations for each pathogen. The third round was focused on validating preliminary findings with interviewees and collecting feedback on findings and insights.
The scorecard
To facilitate cross-pathogen comparisons, a balanced scorecard was deployed, assessing pathogens on impact, probability of R&D success and probability of uptake:
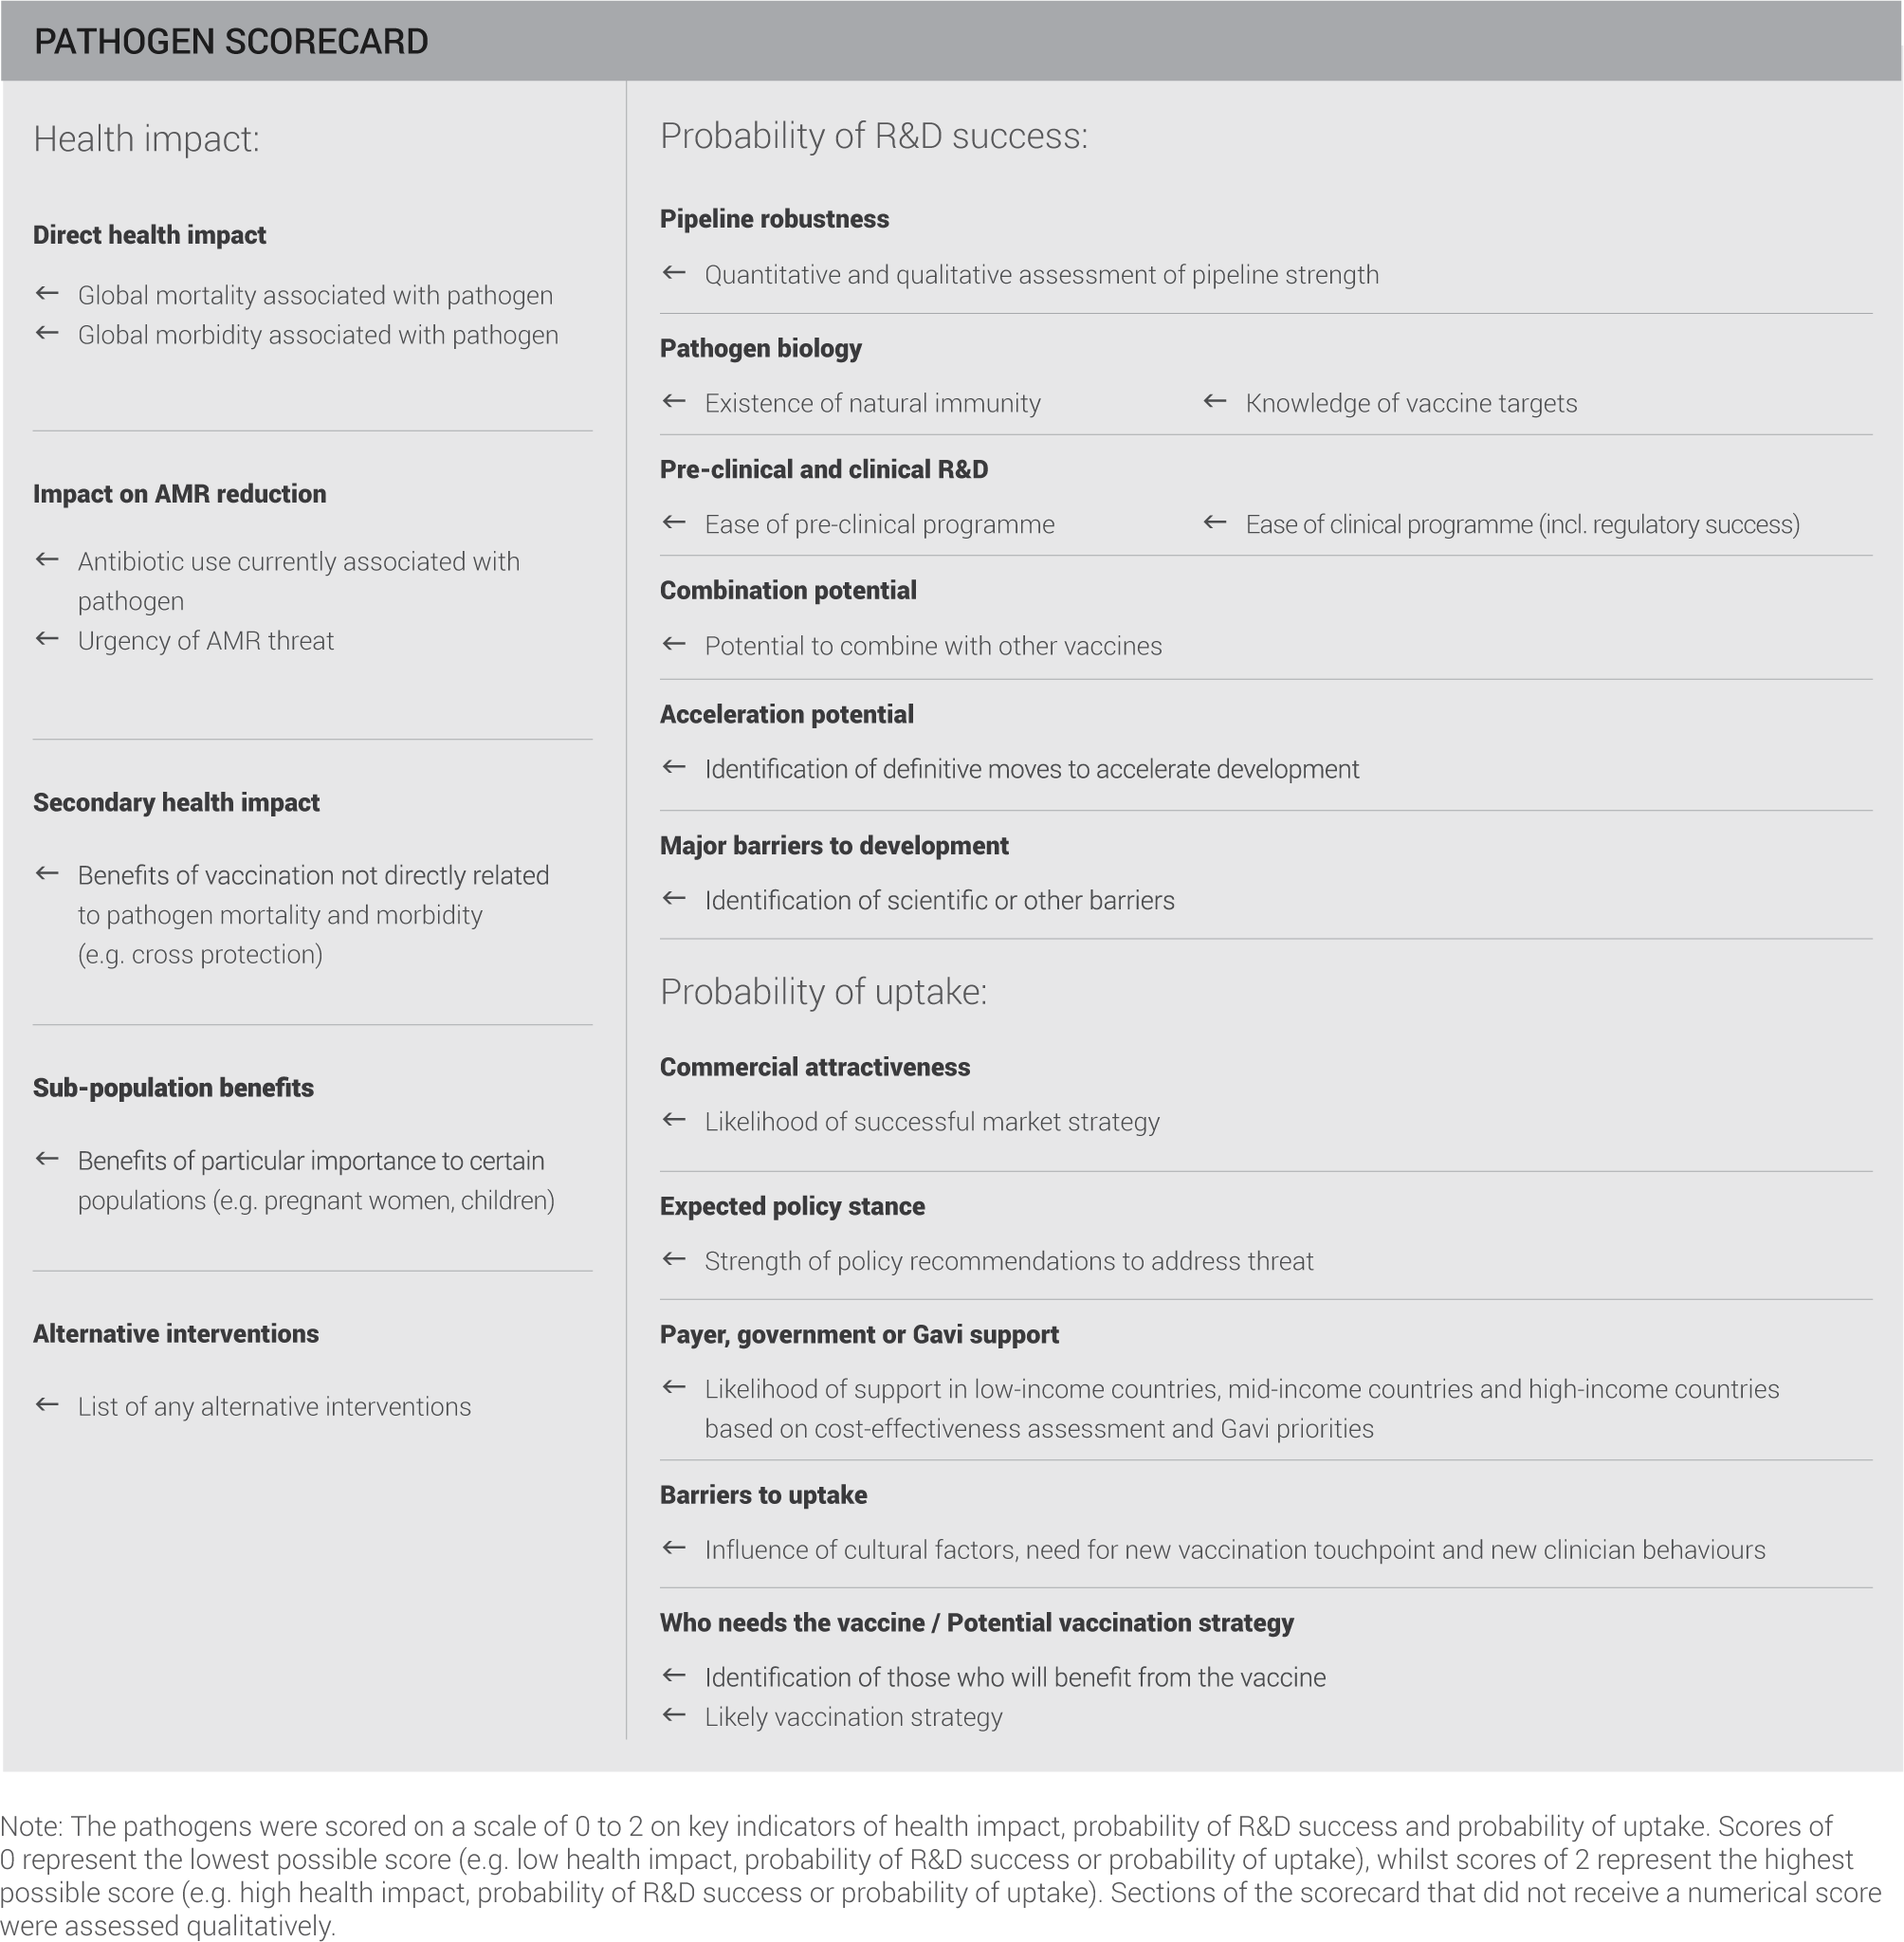
Fields shaded in grey represent qualitative assessments included for extra information and detail.
Potential health impact
Incidence, Morbidity and Mortality
IHME data was used where available as it provided a high level of granularity for the pathogens in this report. Wherever possible this was cross-checked against WHO data and any discrepancies explored during expert interviews. Based on expert opinion, WHO data for TB mortality was selected over IHME data for this pathogen. IHME and WHO use a defined methodology and their data is accepted in the global health community.
Where pathogen data was not reported in the IHME or WHO datasets, the literature was searched for review articles and meta-analyses providing estimates of disease burden at a global level. These sources are generally viewed with a lower confidence compared to IHME or WHO datasets.
Where the above data sources were not available, global disease burden was estimated by combining estimates of global disease from clinical conditions (for example, cellulitis, pneumonia, endocarditis, and others) with estimates of global causative organism splits for each condition. Data on global disease burden from clinical conditions was generally taken from IHME datasets. As a simplification, causative organism splits for incidence were then used to attribute morbidity and mortality of a clinical condition to the pathogen of interest.
Whilst necessary due to limitations of the available data, this approach produces results of a lower confidence which must be interpreted with caution but likely reflects the correct order of magnitude of pathogen health impact.
The detailed methodology for this estimation is below:
| Pathogen |
Data Source / Assumptions |
| A. baumannii |
|
| Campylobacter spp |
|
| Enterobacteriaceae |
|
| E. faecium |
|
| E. coli |
|
| H. influenzae |
|
| H. pylori |
|
| K. pneumoniae |
|
| M. tuberculosis |
|
| N. gonorrhoeae |
|
| P. aeruginosa |
|
| Salmonella spp |
|
| Shigella spp. |
|
| S. aureus |
|
| S. pneumoniae |
|
The estimated global mortality and morbidity was then scored on the following system with thresholds set based upon observed clustering of data:
Urgency of AMR threat
Assessment of this indicator was based on four factors:
- The CDC “Biggest Threats” list
- The WHO Global priority list of antibiotic-resistant bacteria to guide research, discovery, and development of new antibiotics
- Literature review for evidence of resistance / tolerance to last line antibiotics
- Expert opinion
The pathogens were then scored on the following system:
Finally the assessment was discounted by one point on the scorecard where resistance to last-line therapies had been reported but this had not had a significant impact on clinical practice. Whilst all the pathogens evaluated in this report are on the WHO priority list for AMR, some received a score of 0 on this indicator. This is a score given in relation to the other pathogens evaluated and does not indicate that the pathogen poses no AMR threat.
Antibiotic use
The aim of this assessment was to create an initial, order of magnitude assessment of antibiotic uses associated with the pathogen. To this end, for each major clinical condition or infection associated with the pathogen, the incidence of this clinical condition or infection was multiplied by the standard length of treatment. The assessment assumed that:
- All infections are treated
- Treatment is with a single completed course
- Antibiotic choice is for pathogen that has a “normal” level of AMR
- Antibiotic choice is based on recommendations in resource-intensive settings
The estimated global antibiotic use was then colour-coded on the following system with thresholds set based upon observed clustering of data:
A key point in the common recommendations chapter is focused on increasing the robustness of this assessment.
Secondary health impact
This indicator is an assessment of vaccine impact beyond morbidity and mortality for the pathogen of interest, for example cross-protection from other pathogens or reduction in disease risk for conditions not directly associated with infection.
The assessment is based on literature review and expert opinions and although not scored, was included in the scorecard to give a more detailed assessment of the potential health impact of a vaccine.
Sub-population benefits
This indicator is an assessment of sub-populations at particularly high risk of pathogen infection or high impact if infection occurs.
The assessment is based on literature review and expert opinions and although not scored, was included in the scorecard to give a more detailed assessment of the potential health impact of a vaccine.
Alternative interventions
This indicator is an assessment of potential alternative treatment or prevention strategies if AMR rendered current antibiotics ineffective
The assessment is based on literature review and expert opinions and although not scored, was included in the scorecard to give more information about the pathogen.
Probability of R&D success
Pipeline robustness
Vaccine candidates for each pathogen were collated based on searches in the following databases and literature:
- Evaluate Pharma
- PharmaProjects
- Review of major pharmaceutical websites
- Recent literature reviews (from 2013 onwards). Vaccine candidates were included when found to be in active development (confirmed by scientific results published since 2013).
Duplicates were then removed and the data grouped by development phase based on the following groupings:
- Pre-clinical: Academic research, Research project, Pre-clinical
- Phase I: Phase I
- Phase II: Phase II
- Phase III: Phase III, Filed
- Marketed: Approved, Marketed, Phase IV
Points were attributed to each vaccination programme in the pipeline depending on their progress and added up to a final score:
- 1 pt: Research/Pre-clinical
- 2 pts: in Phase I
- 3 pts: in Phase II
- 4 pts: in Phase III
- 5 pts: Marketed
- 1 extra point each for commercially driven vaccination programmes
The results were scored based on the following system:

Finally the assessment was supplemented (+/- up to 0.5 points on scorecard) by a qualitative assessment of the developmental pipeline, taking into account:
- Qualitative assessment of vaccine candidate quality
- Expert opinions/assessments
- Knowledge of pathogen from the same family / genus
This methodology ensures a comprehensive view on the current pipeline; however, it might not be entirely comprehensive given that the literature review was in depth, but not completely exhaustive.
Pathogen biology
Pathogen biology was assessed by looking at the existence of natural immunity, cross-strain immunity and knowledge of vaccine targets.
This was based on literature review and expert opinions and scored based on the following system:
Pre-clinical and clinical R&D
Pre-clinical and clinical R&D was assessed by looking at the ease of pre-clinical and clinical programmes.
This was based on literature review and expert opinions and scored based on the following system:
Combination potential
Combination potential captures policy or scientific support for creating a combination vaccine.
This qualitative assessment is based on literature review and expert opinions – it does not form part of the score for probability of R&D success but is included in the scorecard to give additional information.
Acceleration potential
Acceleration potential identifies key areas where additional focus and investment could accelerate bringing a vaccine to market.
This qualitative assessment is based on literature review and expert opinions – it does not form part of the score for probability of R&D success but is included in the scorecard to give additional information.
Major barriers to development
Major barriers to development describes the common themes from experts and the literature of barriers currently preventing successful vaccine development.
This qualitative assessment is based on literature review and expert opinions – it does not form part of the score for probability of R&D success but is included in the scorecard to give additional information.
Probability of uptake
Who needs the vaccine and potential vaccination strategy
Who needs the vaccine refers to the population who would benefit from a vaccine whereas potential vaccination strategy describes the likely initial target population for a new vaccine. This takes into account epidemiology, likely vaccine product profile, implementation challenges and cost.
It is important to note that for this assessment, the target population described by the likely vaccination strategy may only be a small subsection of the total population that could benefit from a vaccine. This reflects the different commercial routes to market for a new vaccine. For example, whilst there is a large population world-wide who could benefit from a vaccine against certain hospital–acquired infections, the likely vaccination strategy may be to concentrate – at least initially – solely on high risk patients in high-resource settings.
Subsequent sections of the scorecard were assessed in reference to this target population rather than the total population described by “who needs the vaccine”.
This qualitative assessment is based on literature review and expert opinions – it does not form part of the score for probability of uptake but is included in the scorecard to give additional information and as a guide to interpreting later scores in this section.
Expected policy stance
Expected policy stance refers to the likelihood of the relevant policy body supporting vaccination of the target population identified in the potential vaccination strategy above.
This assessment is based on literature review and expert opinions including:
- Incidence, morbidity and mortality assessed in impact section of scorecard
- WHO, SAGE, and PDVAC reports
- Chatham House report
- Expert opinion
- Analogous, currently licensed vaccines
Payer, government or Gavi support
Payer, government or Gavi support refers to the likelihood of the relevant funder supporting vaccination of the target population identified in the potential vaccination strategy above.
This assessment is based on literature review and expert opinions taking into account analogous, currently licensed vaccines, and scored on the following system depending on the likely target population.
Gavi sets priorities for vaccine support programmes every five years through their vaccine investment strategy process. Previous frameworks used in the prioritisation of vaccines have placed a large emphasis on the potential impact of a vaccine on mortality and on the cost-effectiveness of vaccines (cost per death averted).
The funding decisions of governments and payers are informed by cost-effectiveness calculations. These calculations aim to quantify the gains associated with a particular intervention or policy relative to the cost. Gains are often measured in disability-adjusted life years (DALYs), which represented a weighted combination of the mortality and morbidity effects of an intervention. Other possible measures include quality-adjusted life years (QALYs), life years or years of life saved.
Barriers to uptake
Barriers to uptake refers to the potential barriers that would prevent vaccine uptake in the target population identified in the potential vaccination strategy above
This assessment is based on literature review and expert opinions and scored on the following system:
A Green assessment was discounted by 0.5 points where the literature and expert opinions suggested significant investment in infrastructure may be required to support uptake.
Commercial attractiveness
This qualitative assessment is based on literature review and expert opinions taking into account the size and location of the target population and the role of Gavi in funding a vaccination programme. It does not form part of the score for probability of uptake but is included in the scorecard to give additional information.
Weighting of scores and matrix assessment
In order to facilitate cross-pathogen comparisons, each score on the scorecard was weighted with each of the three sections totalling to a score of 100:
| Section | Indicator |
Weighting |
| Health Impact | Mortality | 50% |
| Morbidity | 20% | |
| Urgency of AMR threat | 30% | |
| Probability of R&D success | Pipeline robustness | 40% |
| Pre-clinical and clinical R&D | 30% | |
| Pathogen biology | 30% | |
| Probability of uptake | Expected policy stance | 35% |
| Payer, government or GAVI support | 35% | |
| Barriers to uptake | 30% | |
These weighted scores were then used to create the matrix of Impact vs. Probability of R&D success shown in the Executive summary.